Your watts.
Decoded.
See exactly where your fitness is improving, get per-segment race-day watt targets, and push it all to your Garmin.
Upload a GPX course. Get per-segment power targets and a nutrition plan matched to the terrain - then push it to your Garmin.
How it works
3 STEPS / 30 SECONDSConnect Strava
One click. Your ride history imports automatically — power, heart rate, GPS, everything.
We crunch the numbers
FTP estimation, power curve, fitness trend, aerobic efficiency — calculated instantly from your existing data.
Train and race smarter
Open your dashboard every morning. Upload a race course. Push watt targets to your Garmin. See results.
Am I getting faster?
5 SIGNALS / 1 VERDICTMost apps show you numbers. WattsWise tells you what they mean. Five independent signals - cross-referenced against your history - produce a single honest answer.
Train smarter. Race sharper.
The Platform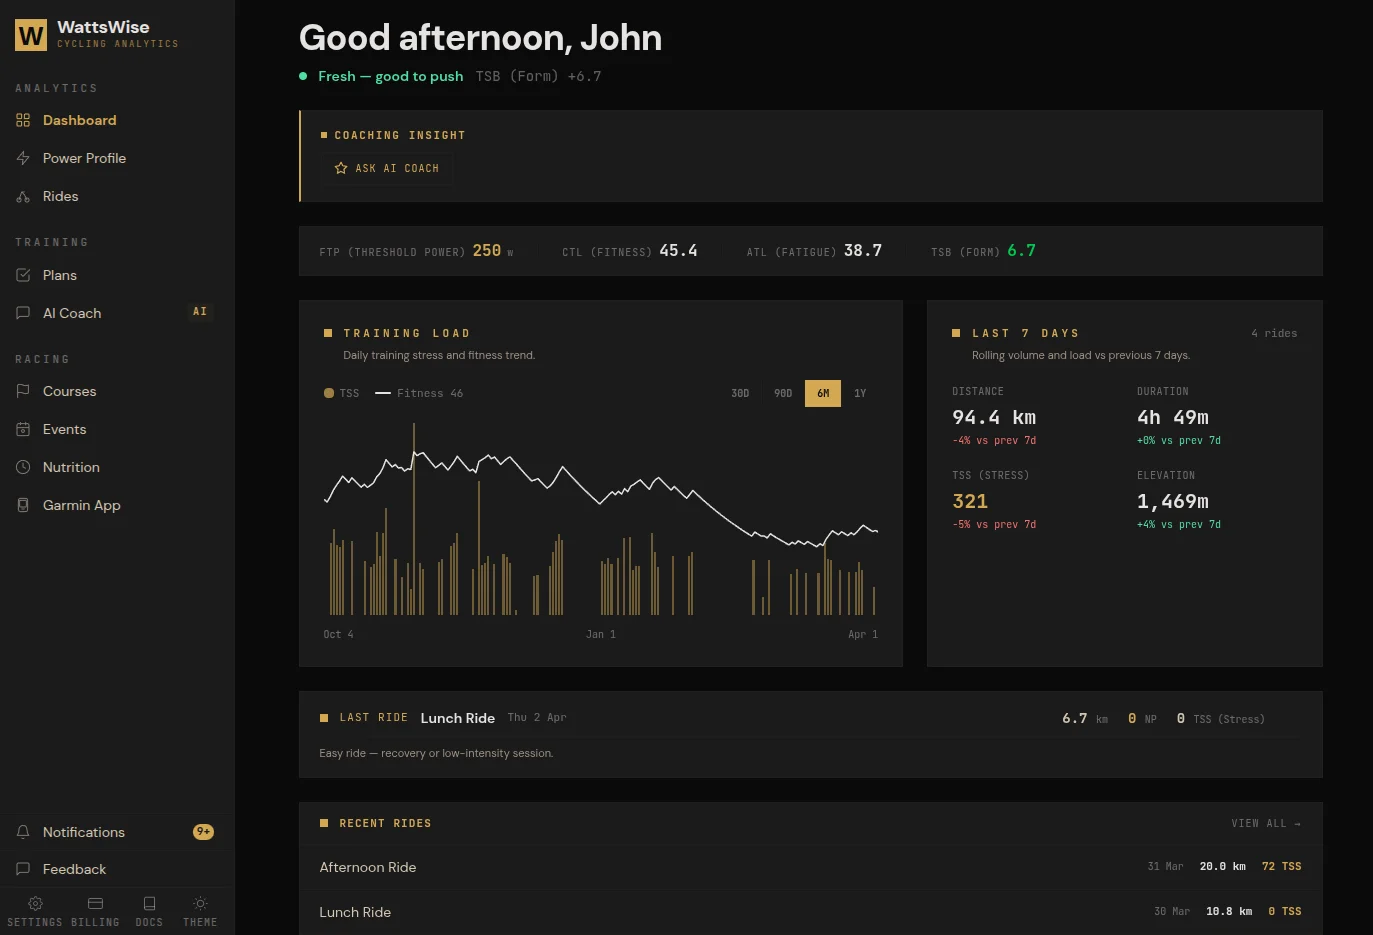
Open It. Know Where You Stand.
Fitness, fatigue, and form at a glance. Your PMC chart, this week's training load vs last week, and an AI summary of your last ride - all above the fold, before your coffee gets cold.
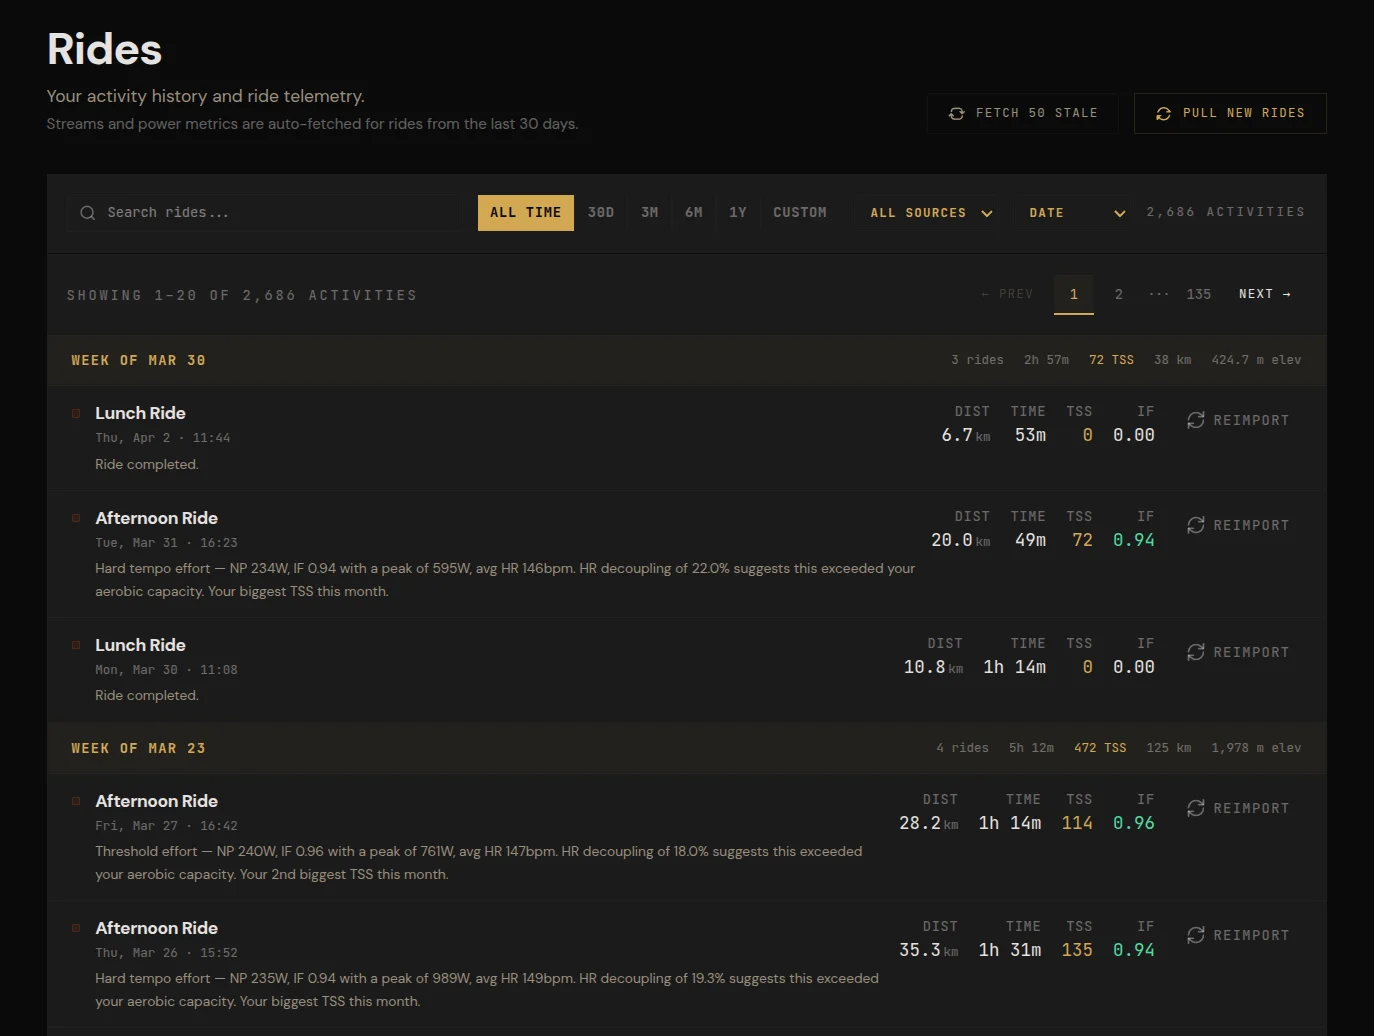
Every Ride. Grouped. Summarised.
Full ride history organised by training week with aggregate TSS, hours, distance, and elevation. Each ride carries an AI coaching summary. Filter by date, search by name, sort by any metric.
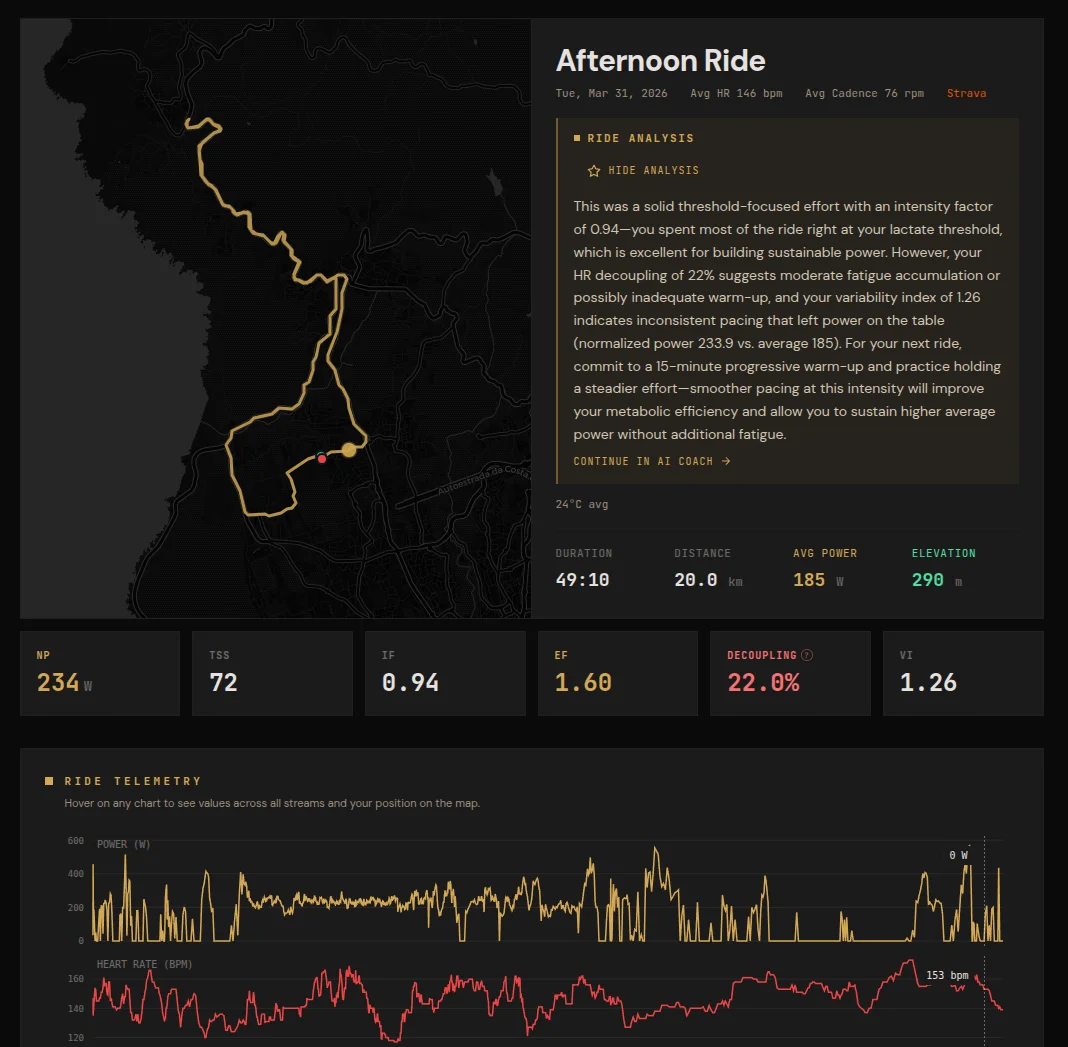
Every Ride, Instantly Decoded
Finish a ride. Open WattsWise. Your AI coach has already analyzed the effort - intensity factor, aerobic decoupling, pacing consistency - and tells you what it means in plain language.
NP, TSS, IF, EF, Decoupling, VI - six metrics computed automatically. Interactive power and heart rate telemetry synced to the map. No clicking “Analyze.” It's already done.
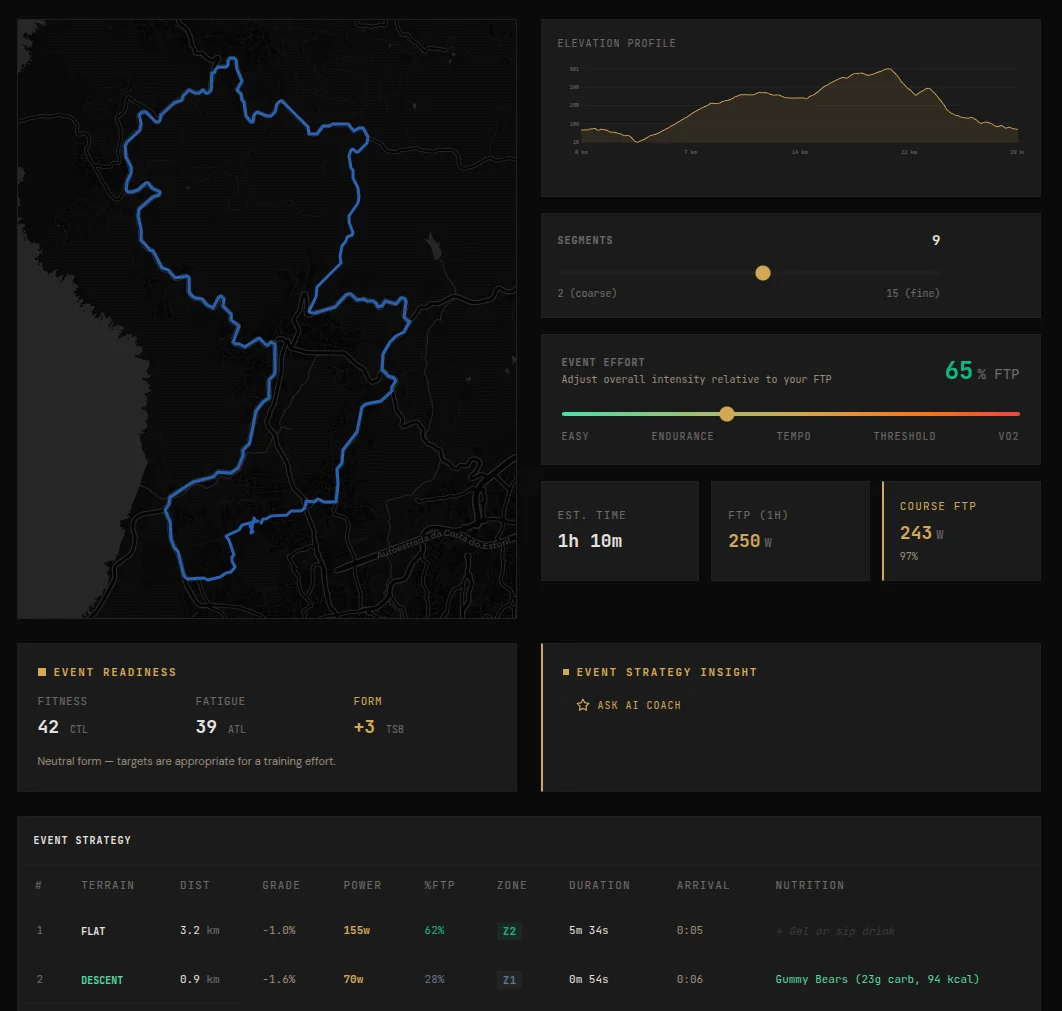
Course Strategy & Live Events
Upload a GPX. The course is segmented by gradient and terrain. You get per-segment power targets from your FTP, a nutrition plan matched to your favourite foods, and an elevation profile with pacing overlay.
Create live events with on-course prize points. Riders claim prizes by GPS proximity, verified server-side. Real-time leaderboard tracks every claim as it happens.
Event Pacing & Nutrition
Not zones - exact watts per segment, calculated from your FTP, the gradient, and the event duration. Nutrition timing matched to terrain and your foods. The strategy downloads to your Garmin before you clip in.
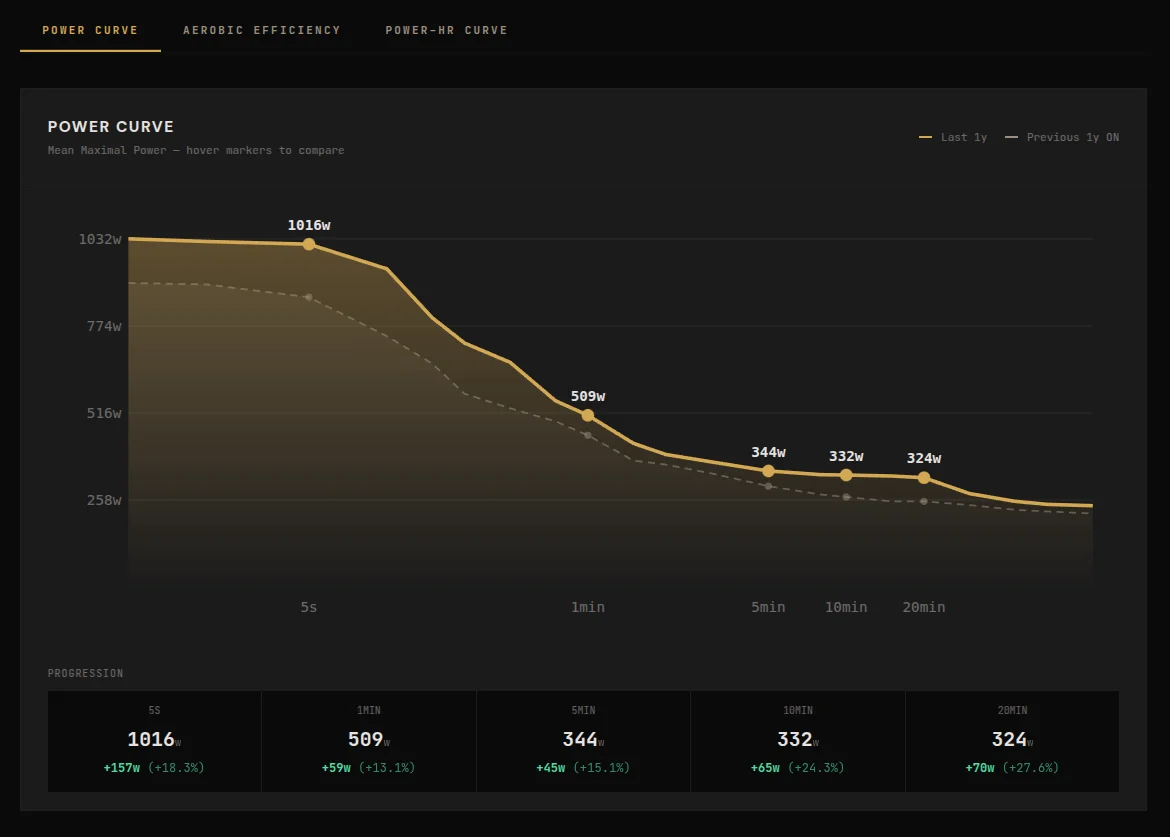
See Exactly Where You've Improved
Your mean maximal power across 21 durations - 1 second to 2 hours. Overlay any previous period and see the watts delta at every point on the curve.
Sprint, anaerobic capacity, VO2max, threshold - each tells a different story about where your training is landing. No guesswork. Gains measured in watts.

Power–Heart Rate Modelling
A regression model that isolates true aerobic fitness from the noise of cardiac drift, temperature, altitude, and fatigue.
Steady-state segments only - not whole-ride averages. Switch between quadratic and linear models. The fitness signal tells you: improving, stable, or declining.
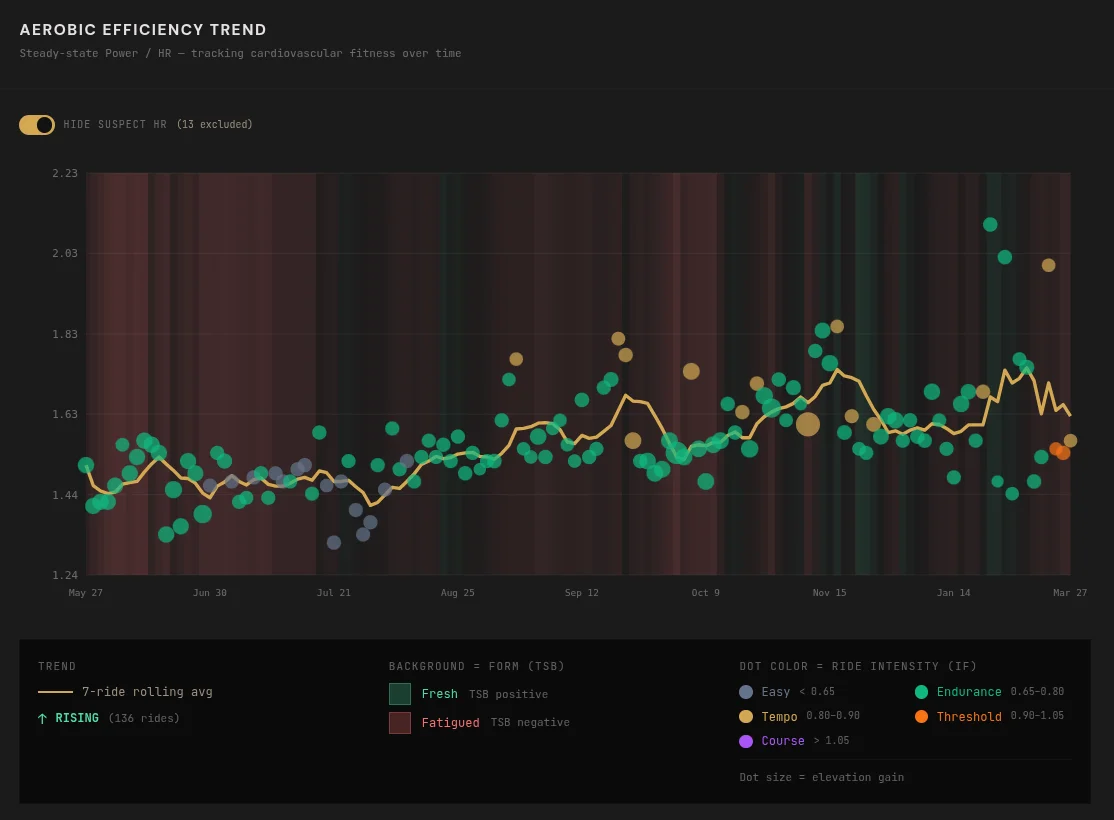
Aerobic Efficiency Trend
Efficiency Factor (Power ÷ Heart Rate) from steady-state segments - the most reliable field-based indicator of improving aerobic fitness.
Rising EF means your heart pumps more watts per beat. Filter suspect HR data. Regression line quantifies direction and confidence.
Other platforms tell you what happened. WattsWise tells you what it means and what to do next.
Garmin Connect IQ
Available Now
Race Intelligence
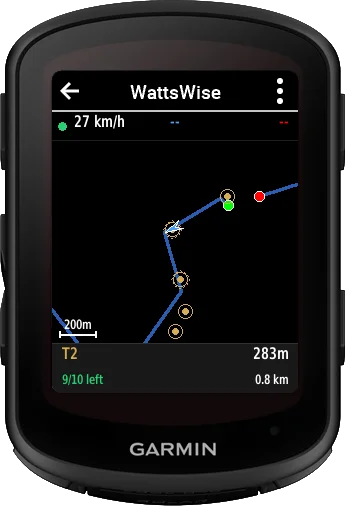
8 purpose-built screens: pacing, 10-field data grid with NP/IF/TSS/W’bal, leaderboard, and course map. Pair once with a 6-digit code. ANT+ power, HR, cadence. Vibration on transitions.
Live Map & Prizes
Route with competitor dots, prize markers with dashed activation radii, and auto-zoom to nearest unclaimed prize. Position synced every 4 seconds. Info bar shows segment and claim status.
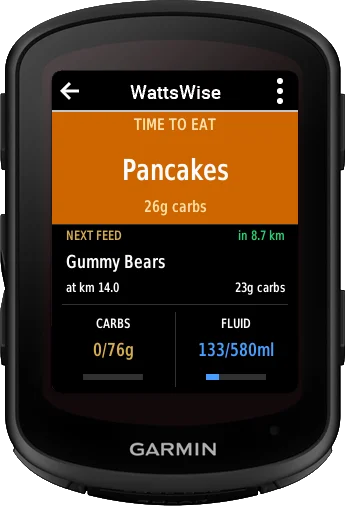
Smart Nutrition
Distance-based feed alerts matched to your foods and terrain. Running carbs and fluid totals. Warning triangle on ALL screens when a feed is pending. 20-minute fallback on slow climbs.
The gap WattsWise fills
No other platform connects training analytics to event-day pacing to live Garmin guidance to post-ride AI analysisin a single flow. Most athletes juggle 3–4 tools. WattsWise is one pipeline – from the data on your ride to the watts on your screen on event day.
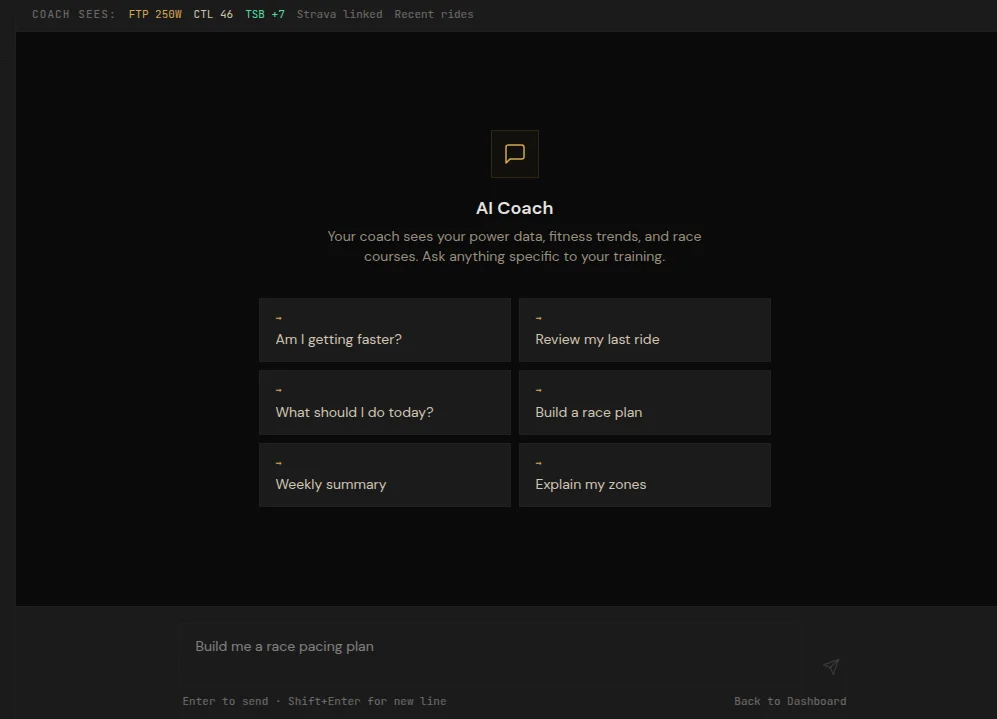
AI Coach With Full Context
Not a generic chatbot. Your AI Coach has full context on your ride history, power and heart rate profiles, fitness trends, training plans, courses, and upcoming events.
It can review your last ride, recommend training adjustments, build targeted training plans, design event-day pacing strategies with per-segment power targets, and create nutrition timing plans - all based on your actual data.
Everything. Free.
Full access to every feature during beta. No credit card. No time limit. Beta testers get 3 months free after launch.
No credit card required · No time limit during beta
Ready to ride smarter?
Every feature. Free during beta. Your Strava data imports in seconds.
No credit card · No time limit · Beta testers get 3 months free after launch